More About the Image Histogram
Overview
The histogram feature, available by clicking ![]() in the Output pane, is a graph that shows the number of pixels in an image at each different intensity value found in that image.
in the Output pane, is a graph that shows the number of pixels in an image at each different intensity value found in that image.
For a grayscale image, the graph displays the intensity values showing the distribution of pixels amongst the grayscale values from left to right, from the darkest to the lightest tones.
For a color image, individual graphs of red, green and blue are superimposed on the same histogram, with intensity values also displayed from left to right, from the darkest to the lightest tones.
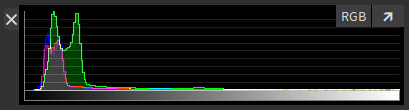
Histogram of a color image
|
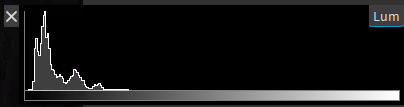
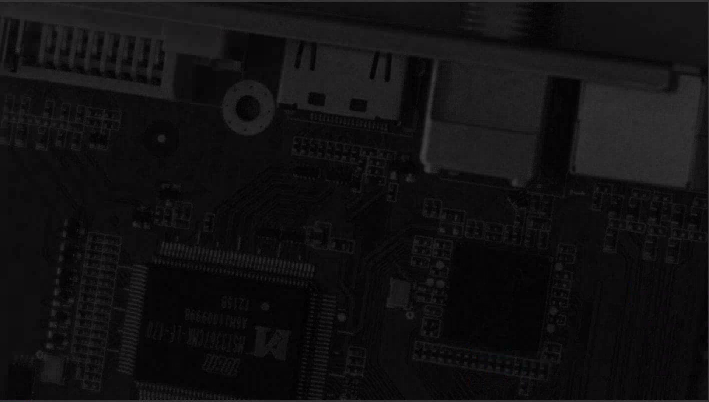
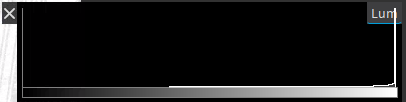
The histogram below shows that the intensity values are concentrated towards the left: The image contains too many dark pixels: |
|
|
|
|
|
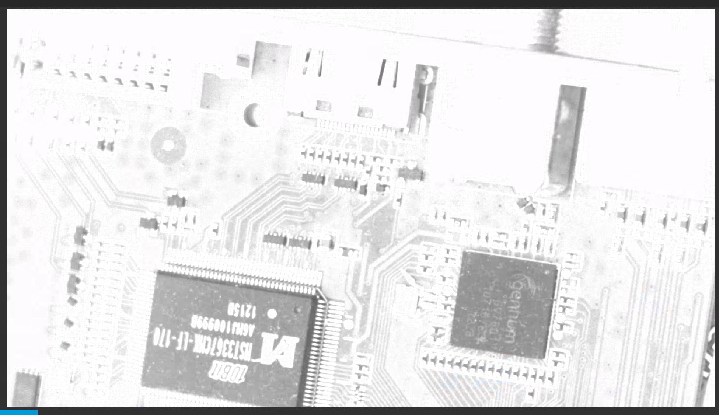
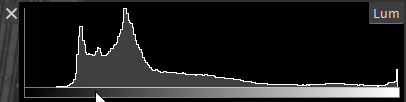
The histogram below shows that the intensity values are concentrated towards the right: The image contains too many light pixels: |
|
|
|
|
|
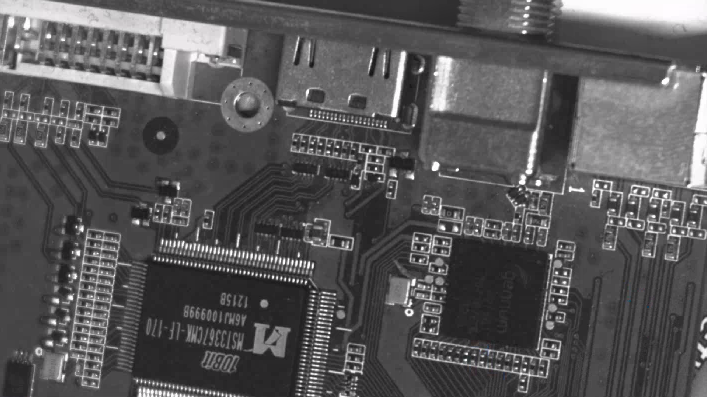
The histogram below shows that the intensity values cover a broad and more central range of intensity values: The image shows a better brightness balance, although it still contains more dark pixels: |
|
|
|
|
| In order to ... | Proceed as follows: |
|---|---|
| View each pixel channel in a color image |
Click one or more times on RGB. |
| Enlarge or reduce the Histogram pane |
Click the arrow on the right of the Histogram pane. |
| Close the Histogram pane |
Click the cross on the left of the Histogram pane. |
If an image format is not supported, the histogram is displayed as RGB values.