Browse Through Traces
This procedure allows you to zoom in and out by changing the timescale in the message plot (or Analyzer plot) in a general way.
| 1. | Hover over the requested position in the message plot. |
| 2. | Rotate the mouse wheel up to zoom in and down to zoom out. |
To zoom faster, press CTRL and rotate the mouse wheel as described in step 2.
This procedure allows you to zoom in onto a specific portion of the message plot (or Analyzer plot).
| 3. | On the message plot, right-click the position you will start zooming from. |
| 4. | Drag the mouse to the right up to the position you want to stop zooming. |
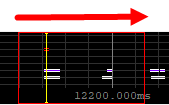
As you drag, a red rectangle is displayed showing the portion to be zoomed on:
When you release the mouse, the zoomed portion is stretched to the whole plot area.
Repeat this action to dig more precisely in the message plot or Analyzer plot.
When traces are available on the left or right of the time frame displayed in the message plot, a red arrow appears on the left border  or right border
  of the message plot (or Analyzer plot).
| ● | In the message plot, click and drag to the left or right to change the displayed time frame keeping the same zoom level. |
Move rapidly up and down in the message list with the standard shortcut keys:
| ● | PAGE UP to move up in the message list and display the previous set of messages. |
| ● | PAGE DOWN to move down in the message list and display the next set of messages. |
| ● | HOME or G to move to the top of the message list. |
| ● | END to move to the bottom of the message list. |
| ● | SHIFT + G to move to the bottom of the message list and set the Follow/Following option to Following. |
You can generate a plot corresponding to all traces of the current boot session, to the traces displayed in the message list or to a selection of traces.
The procedures below describe the various ways to plot message traces in the message plot. Similar controls are available to build graphs of Analyzer traces in the Analyzer plot.
| ● | Right-click in the message list and select Plot > All from the context menu. |
The number of traces displayed is limited to the maximum capacity of the viewer buffer.
| ● | Right-click in the message list and select Plot > View from the context menu. |
| 1. | Select the first message in the message list. |
| 2. | Scroll to the last message of your selection. |
| 3. | Simultaneously press SHIFT and click the last message to select all messages between the first and the last. |
| 4. | Right-click the message list and select Plot > Selection from the context menu. |
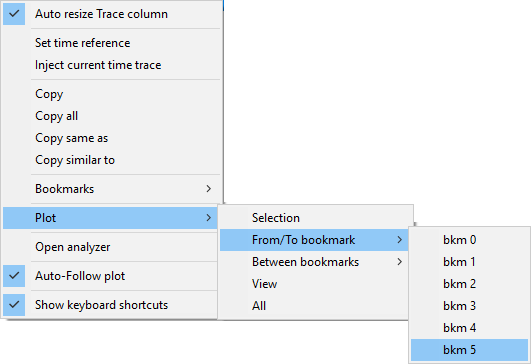
This option is only available when at least one bookmark has been defined. See Define Bookmarks.
| 1. | Click the message that you want to view the plot from/to. |
| 2. | Right-click, then select Plot > From/To bookmark and the requested bookmark name. |
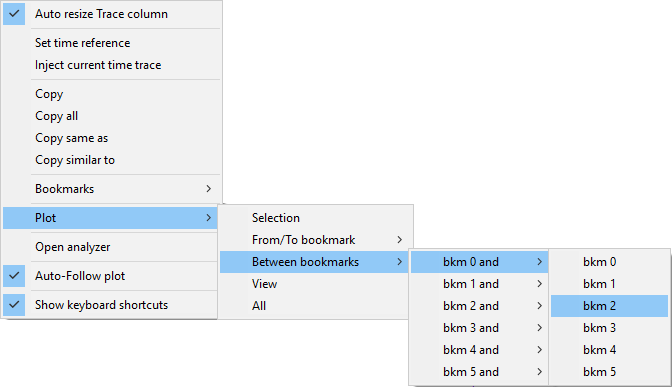
This option is only available when two bookmarks have been defined. See Define Bookmarks.
| ● | Right-click in the message list, select Plot > Between bookmark and the boundary bookmarks in the subentries of the context menu. |
To build graphs of Analyzer traces, proceed similarly using the Analyze item in the context menu of the message list, and the corresponding subitem.