SEMI T10-0701 for Data Matrix Codes
SEMI T10-0701 is a grading standard intended to provide quality indicators for DPM (Direct Part Mark) Data Matrix codes. It does not provide guidelines for paper-printed ones.
|
●
|
SEMI T10-0701 does not provide grades as defined by the other standards. It does not give ratings (A to F or 4.0 to 0.0) but only numerical values. |
|
●
|
The interpretation of these numerical values is left to the application and can depend on the application context. |
SEMI T10-0701 is pixel-based, in contrast to the other standards. As such, it can be more suited to computer vision purposes, as the specifications are designed with computer processing in mind.
SEMI T10-0701 quality indicators
The symbol contrast
|
●
|
The symbol contrast measures the relative distinctiveness between the light and the dark parts of the code. |
|
●
|
The closer the symbol contrast is to 100%, the more the marks and the spaces are color-separated and the code easier to read. |
|
●
|
A mark is defined as a cell of the data matrix that is modified by the marking process (where the substrate is altered, usually resulting in a darker color) while a space, conversely, is left untouched. |
|
►
|
A low contrast score can indicate either a bad printing quality, a bad image contrast or an incorrect code illumination. The detection and the digitization are more difficult as it is difficult to separate the code from the background. |
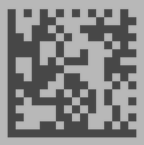
A low contrast data matrix
The symbol contrast SNR
|
●
|
The symbol contrast SNR (Signal to Noise Ratio) measures the relative strength of the noise in the code. You can also see it as the ratio of the useful dynamic (symbol contrast) used to separate white from black. |
|
●
|
The higher this value, the less noise is present in the image of the code. |
|
►
|
If this grade is low, the digitization is more difficult as it is difficult to separate light from dark. |
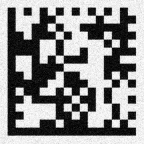
A noisy data matrix
The mark growth
|
●
|
The mark growth is the measure of the relative size of a mark compared to a space. |
|
□
|
A value around 50% is ideal, as it means that the marks and the spaces are about the same size. |
|
□
|
A value over 50% means that the marks cells are bigger than the spaces, hinting at overmarking. |
|
□
|
A value under 50% hints at undermarking. |
|
●
|
The mark growth is computed as 2 separate values: the horizontal mark growth and the vertical mark growth. |
|
►
|
If the mark growth deviates from the ideal value (50%), the digitization is more difficult as some cells eat up part of the neighboring cells. |
.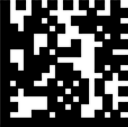
A data matrix showing mark growth
The data matrix mark misplacement
|
●
|
The data matrix mark misplacement is the measure of the relative distance between the ideal position of a mark and its real position in the data matrix. The center of the mark is used as its position. |
|
●
|
The bigger this value, the more the data matrix is potentially deformed. |
|
●
|
The data matrix mark misplacement is computed as 2 separate values: The horizontal data matrix mark misplacement and the vertical data matrix mark misplacement. |
|
►
|
This grade is just an indicator of the cell position errors. Unless extreme, it should not hinder the processing. |


Data matrices showing vertical (left) and horizontal (right) mark misplacement
The cell defects
|
●
|
If the data matrix can be decoded, the correct placement of the marks and the spaces can be determined, and the cell defects value can be computed. |
|
●
|
The cell defects value is the measure of the ratio of incorrect pixels (pixels that have the wrong color) to the total number of pixels in the data matrix code. |
|
►
|
A high cell defects value hints at mark damage, space pollution, difficulties to separate the marks from the spaces or that there is a lot of noise in the image. This can hinder the reading of the code. |
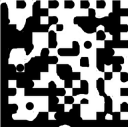
A data matrix showing cell defects
The finder pattern defects
|
●
|
The finder pattern defects is the same kind of measure as cell defects but computed only on the cells of the finder pattern of the data matrix code. |
|
►
|
A high Finder Pattern Defects value hints at damage to the Finder Pattern, especially if the Cell Defect is otherwise markedly lower. Finder pattern damage might prevent the recognition of a candidate as a valid code. |

A data matrix showing finder pattern defects
The unused error correction
|
●
|
The unused error correction is the measure of how much of the error correction capability of the data matrix code was not used. |
|
●
|
The closer this value is to 0, the more error correction was applied to read the code. |
|
►
|
A low unused error correction can hint at errors in the code itself, difficulties to correctly determine the color of a cell or damage in the marks. It is also a sign that any further degradation of the acquisition conditions will lead to a decoding failure. |
The data matrix cell size
|
●
|
The data matrix cell size is the mean size, in pixels, of a cell in the data matrix. |
|
●
|
The data matrix cell size is computed as 2 separate values: the data matrix cell width (horizontal) and the data matrix cell height (vertical). |
|
►
|
You can use these values to compute the code anisotropy. |