Validating the Results
In Deep Learning Studio:
|
●
|
The metrics are always computed without applying data augmentation on the images. |
|
●
|
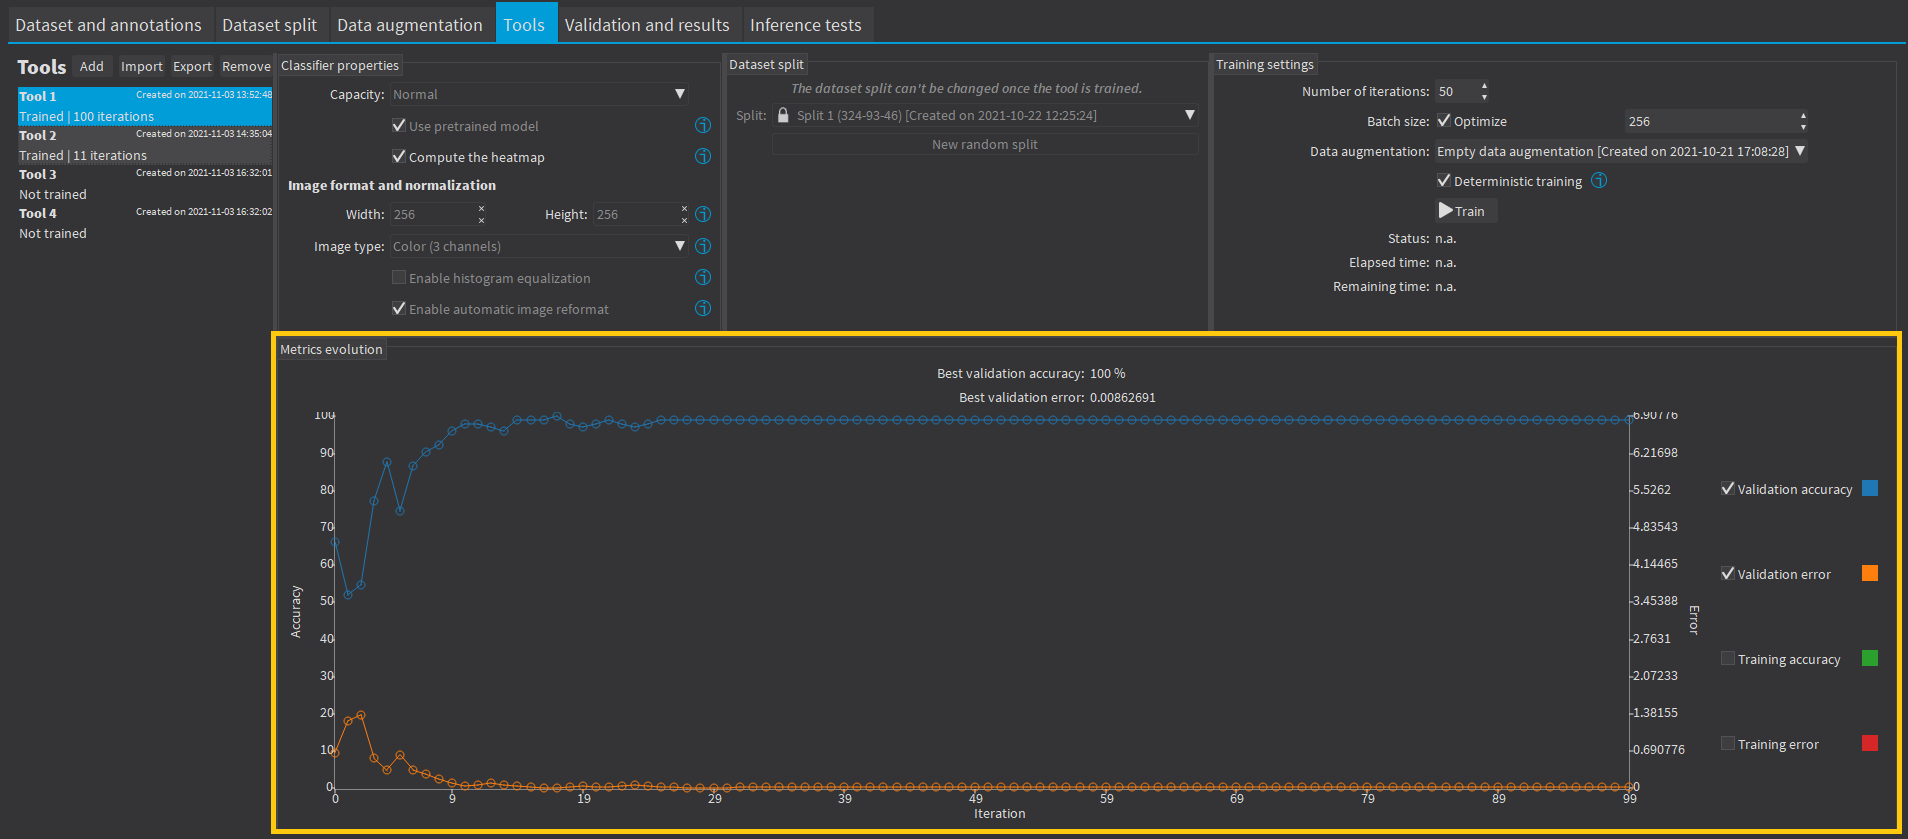
In the tab Tools, the metrics Best validation error and Best validation accuracy are computed during the training using the label weights. The evolution of several metrics during the training is also available. |
|
●
|
The results are available in the tab Validation and Results. |
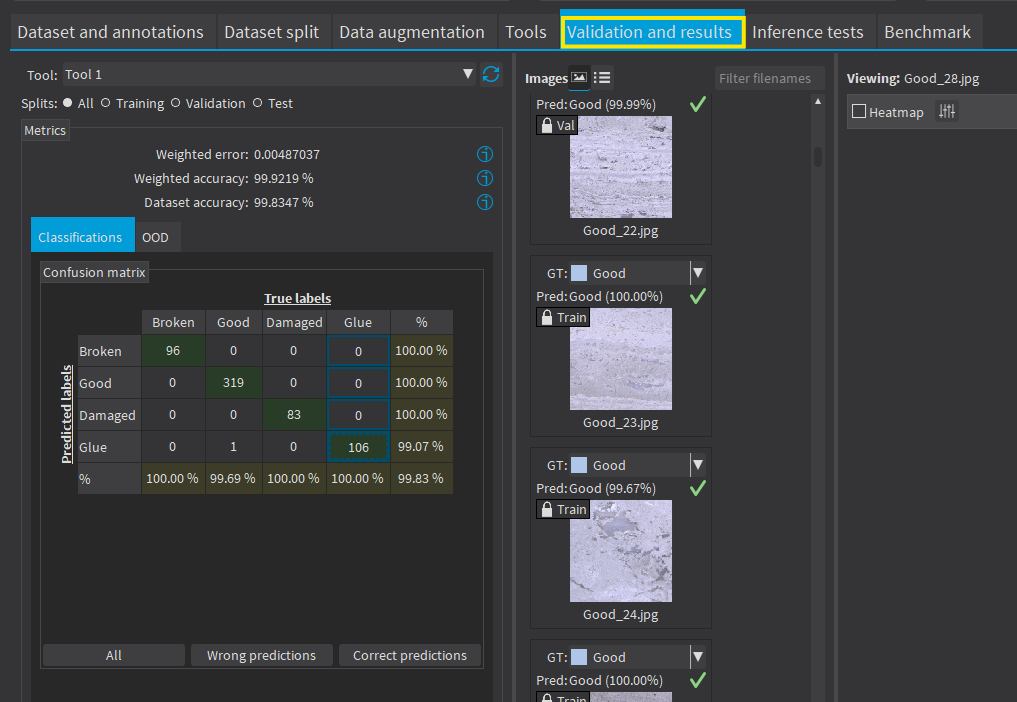
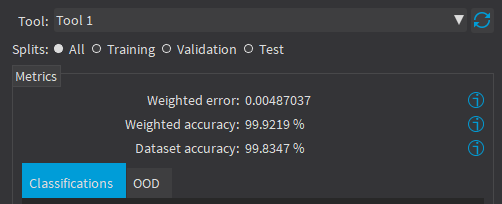
There are 3 metrics displayed:
|
□
|
The weighted error and the weighted accuracy (normalized with respect to the label weights instead of being dependent of the number of images for each label). |
|
□
|
The dataset accuracy (it does not use the label weights). |
If your dataset has a very different number of images for each of the labels, it is called unbalanced. In this case, the dataset accuracy is biased towards the labels containing the most images (the dataset accuracy mainly reflects the accuracy of these labels).
|
●
|
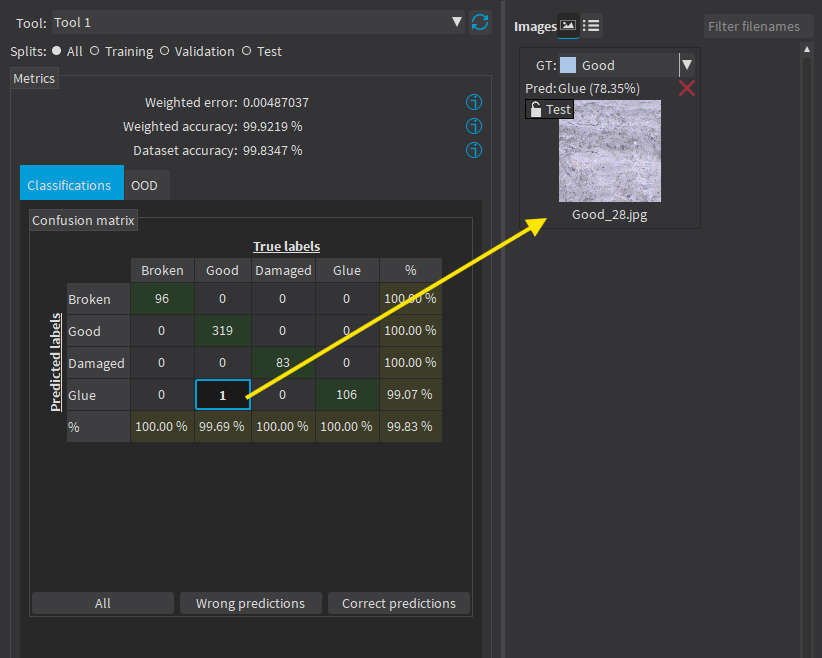
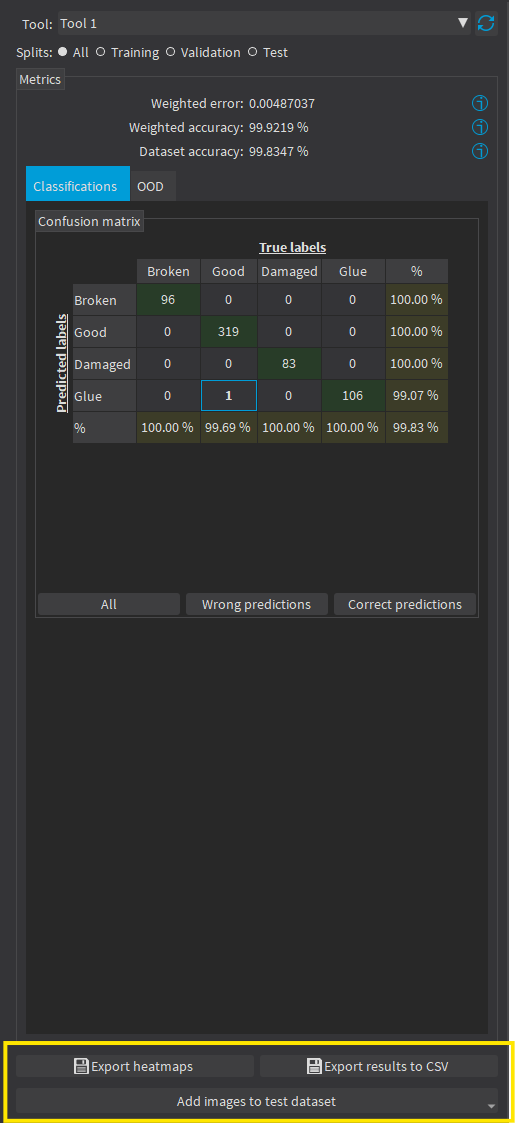
In the tab Classification, the confusion matrix shows the number of images according to their true labels and their label predicted by the classifier. |
|
□
|
The diagonal elements of the matrix shown in green are the correctly classified images. |
|
□
|
All the other elements of the matrix are badly classified images. |
|
□
|
Select one or more elements of the matrix to show the corresponding images. |
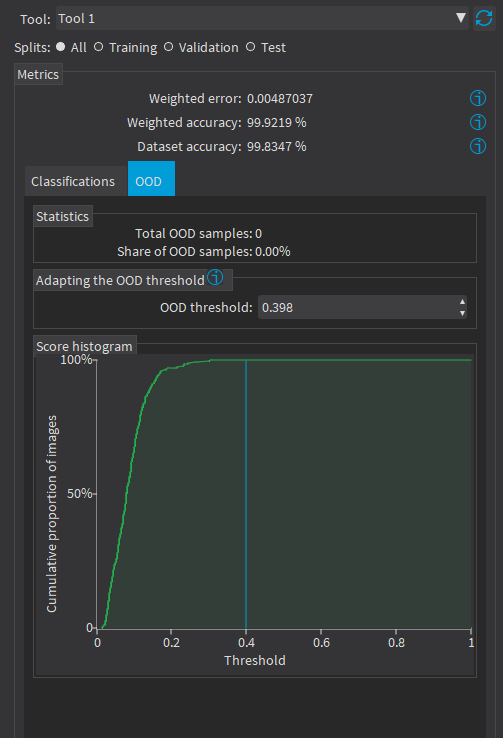
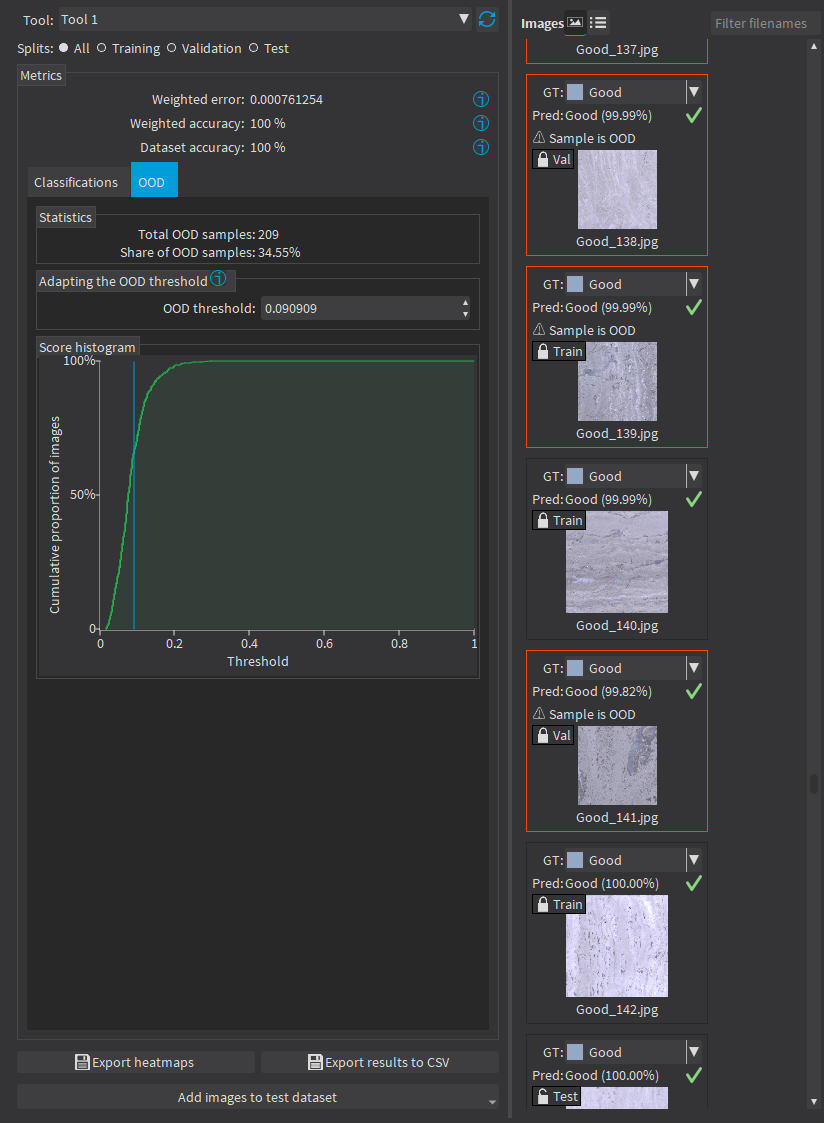
- The number of samples that are identified as out of distribution.
- The corresponding OOD threshold.
If the default threshold value is not satisfactory, you can manually input a threshold in Adapting the OOD threshold or use the mouse to drag the threshold on the score histogram.
|
□
|
Individual images identified as OOD are highlighted in red. |
|
□
|
In the table, click on the cells and the headers to select OOD or non-OOD images and specific labels. |
|
□
|
Use the button Export heatmaps below the metrics widget to export the heatmap for each image of your dataset. |
- The heatmaps are saved in the PNG format under the name ImageName_ToolName_heatmap_UniqueId.png.
- This feature requires a Deep Learning license.
|
□
|
Use the button Export results to CSV below the metrics widget to export the results for each image of your dataset as rows of a CSV file. |
- Each record contains the image filename, the ground truth label, the predicted label, the prediction probability, the OOD detection result and the probabilities for all the labels recognized by the tool.
In the API:
|
●
|
After the completion of each iteration, EasyClassify automatically computes several performance metrics about the training and validation dataset: |
|
□
|
After the training, the classifier is back in the state corresponding to this best iteration. |
|
●
|
The metrics are represented by an EClassificationMetrics object that contains the following performance metrics: |
|
□
|
The classification error (EClassificationMetrics.Error), also called the cross-entropy loss: the quantity that is minimized during the training. It is computed from the probabilities computed by the classifier. |
- The error for a single image is the negative of the logarithm of the probability corresponding to the true label of the image. So, if this probability is low, the error for the image is high.
- The error of the dataset is the average of the errors of each image in the dataset.