More About the Line Profile
Overview
The line profile feature, available by clicking ![]() in the Output pane, draws a line on the top of the displayed image, and shows the corresponding line profile plot at the bottom of the pane.
in the Output pane, draws a line on the top of the displayed image, and shows the corresponding line profile plot at the bottom of the pane.
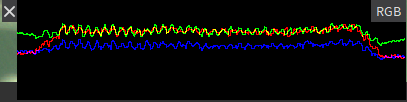
The line profile plot shows the light intensity values (monochrome image) or color intensity values (color image) on the various points along the line segment (line profile) drawn on the image.
Examples
|
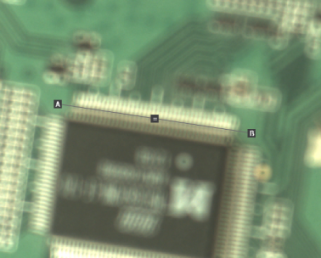
When the image is not sharp enough, the line profile plot shows a rather flat profile. |
|
|
|
|
|
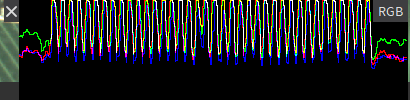
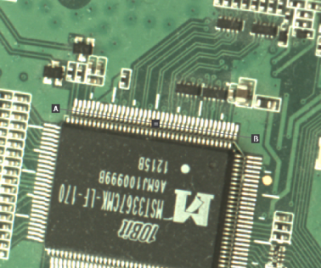
When the image is sharp, the line profile plot shows a uneven or jagged profile. |
|
|
|
|
Possible actions
| In order to ... | Proceed as follows: | ||||||
|---|---|---|---|---|---|---|---|
| Move or resize the line profile |
|
||||||
| View line profile of each color component |
In the line profile plot, click one or more times RGB in the upper right corner. |
||||||
| Close the line profile |
In the line profile plot, click the cross on the left of the Line Profile pane. |