Use Analyzer Tools
Most actions available for message traces in the message plot are also available for Analyzer traces in the Analyzer plot. This is explicitly specified in the relevant procedures:
| ● | Browse Through Traces |
| ● | Using Time Information |
When the description of Analyzer traces is displayed in the message list (see Configure Traces for Analysis), you can search for these traces as described in the section Search for and Find back Traces.
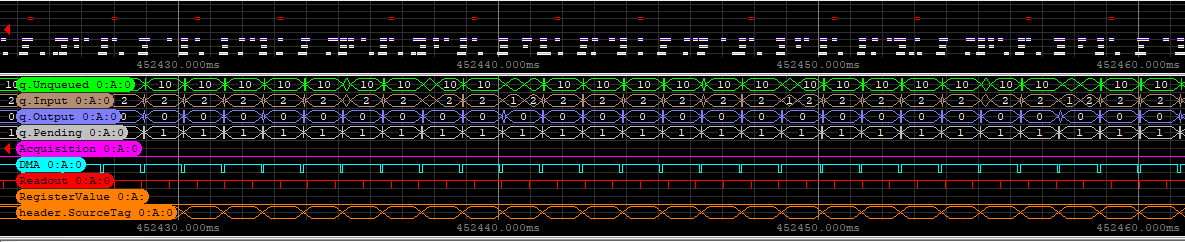
You can build a graph of Analyzer traces in the same way as you can plot the message traces. Similar controls are available, as well as controls that imply the use of bookmarks.
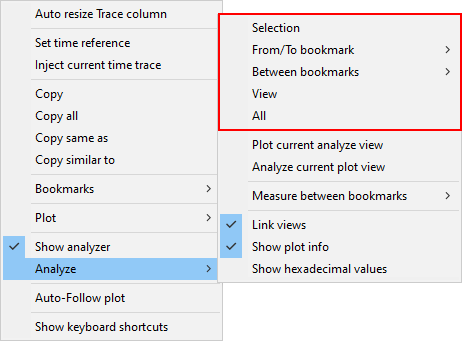
You can access the various controls for building Analyzer graphs in the context menu of the message list, from the Analyze menu.
These controls are highlighted in the screenshot below:
See the section Display the plot for a set of traces for procedures on how to use these controls.
When the Link views option is disabled and both message plot and Analyzer plot show different time frames, you can rapidly plot the message traces in the message plot based on the time frame displayed in the Analyzer plot:
| ● | Right-click in the message list and select Analyze > Plot current analyze view from the context menu. |
Example
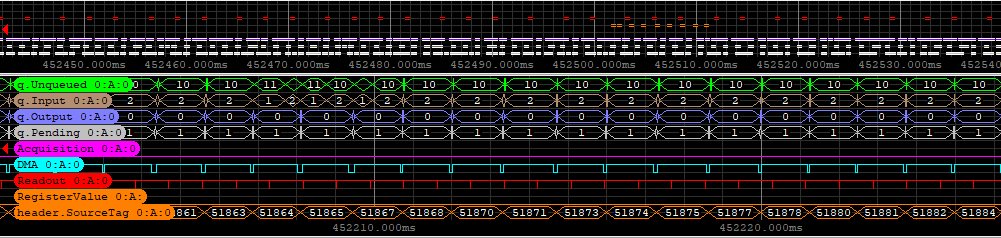
In the initial situation, the Analyzer plot covers a different time frame than the message plot:
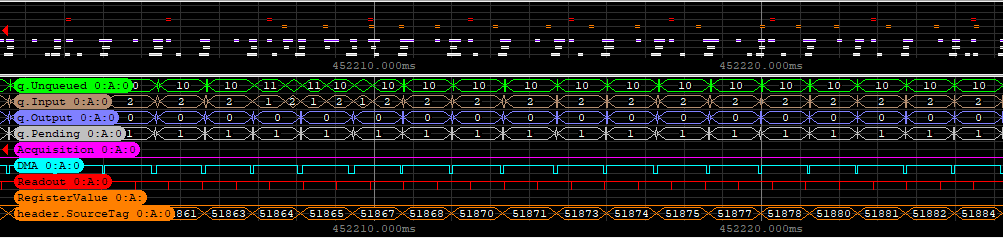
After selecting the option to plot the current analyze view, Memento builds a plot in the message plot that spans over the time frame displayed in the Analyzer plot:
When the Link views option is disabled and both message plot and Analyzer plot show different time frames, you can rapidly build waveforms in the Analyzer plot based on the time frame displayed in the message plot:
| ● | Right-click in the message list and select Analyze > Analyze current plot view from the context menu. |
Example
In the initial situation, the Analyzer plot covers a different time frame than the message plot:
After selecting the parameter to build a graph of the current plot view, Memento spans the waveforms in the Analyzer plot over the time frame displayed in the message plot:
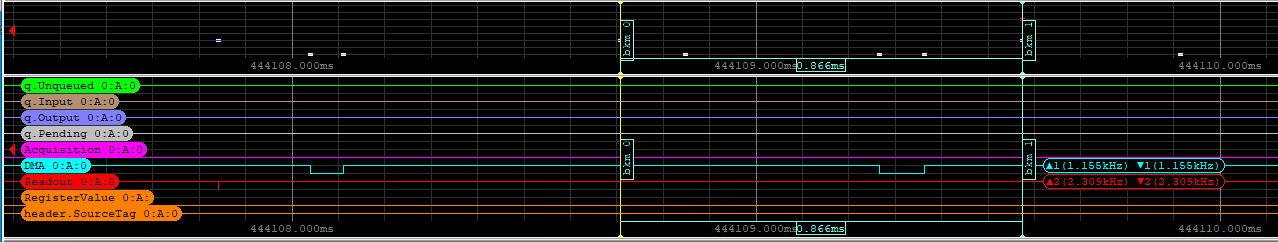
You can measure the number and frequency of events over a given time frame for all displayed waveforms:
| 1. | Set two bookmarks to identify the time frame that you want to analyze the events in: |
| a. | Press CTRL and click on an event in the Analyzer plot to set the position for a new bookmark. |
| b. | Press F4 to add the bookmark. |
| c. | Repeat both previous actions to define a second bookmark. |
| 2. | Right-click in the message list to open the context menu. |
| 3. | Select Analyze > Measure between bookmarks as well as the boundary bookmarks in the context menu. |
The number and the frequency of events over the defined time frame are displayed on the right hand of the Analyzer plot, as highlighted in the screenshot below:
To call up the previous trace on a waveform and display it at the cursor position in the Analyzer plot:
| ● | Position the mouse cursor on a given waveform around the position you are searching for events and middle-click the mouse. |
The waveform will shift and display the previous trace on that waveform.